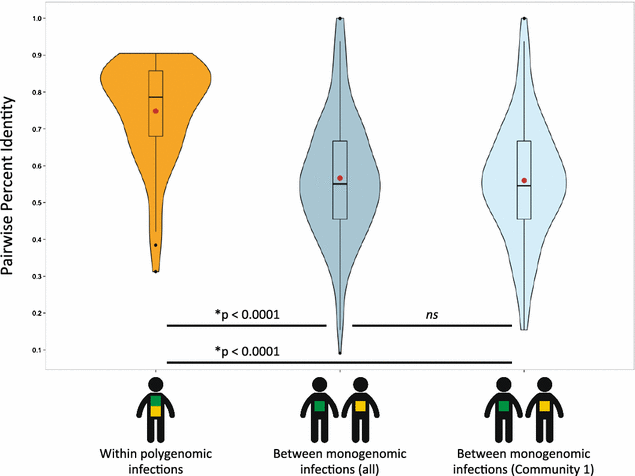
Fig. 4

The distribution of genetic similarity among polygenomic and monogenomic infections. Violin plots of the distribution of pairwise percent identity among polygenomic and monogenomic infections. Means are marked with a red point. Boxplots are shown within the violin plots with the median, interquartile range (IQR), and data points more than 1.5 × IQR from the upper or lower quartiles (outliers) marked. P values determined by bootstrap sub-sampling (see “Methods” section). ns not significant